In today’s fast-paced digital landscape, businesses increasingly rely on microservices architectures to achieve agility, scalability, and innovation, but this comes with the intricate challenge of managing a highly distributed system. Unlike the simplicity of monolithic applications, microservices split functionality into numerous independent components, each operating in isolation across varied environments. This fragmentation often leads to silent performance issues that can spiral into major disruptions if not addressed promptly. Monitoring such a complex setup is no longer just a technical necessity; it’s a critical factor in ensuring reliability and delivering exceptional user experiences. The journey to mastery involves transforming overwhelming streams of raw data—logs, traces, and metrics—into clear, actionable insights. By embracing robust strategies, it’s possible to maintain system health, prevent cascading failures, and align technical performance with overarching business goals. This exploration dives deep into the essential practices that can elevate monitoring from a daunting task to a streamlined, empowering process.
Establishing a Foundation with Standardized Observability
Navigating the chaos of microservices monitoring begins with the adoption of standardized observability practices. This approach focuses on creating uniform methods for data collection across all services to ensure consistency and clarity. Structured logging, often in formats like JSON, captures vital details such as timestamps and unique request IDs, while distributed tracing tools track requests as they travel through multiple services. Metrics like latency, error rates, and request counts must also follow a standardized format to enable meaningful analysis. Without this level of uniformity, the data generated by disparate services becomes a fragmented puzzle, nearly impossible to piece together when diagnosing issues. Standardization acts as the bedrock, allowing teams to correlate events and identify anomalies with precision, ultimately reducing the time spent on troubleshooting in a distributed environment.
Beyond the initial setup, standardized observability fosters a cohesive understanding of system behavior across diverse teams and tools. By ensuring that every service logs data in the same structured way, it becomes easier to integrate and analyze information, regardless of the specific technology stack in use. Distributed tracing, for instance, provides a detailed map of how requests interact with various components, pinpointing bottlenecks or failures with accuracy. Similarly, uniform metrics allow for consistent benchmarking of performance, helping to establish baselines for what constitutes normal operation. This consistency eliminates the guesswork that often plagues monitoring efforts in complex systems, replacing it with a clear framework for data interpretation. As a result, teams can focus on resolving issues rather than deciphering mismatched data, paving the way for faster incident response and more reliable systems that support business objectives.
Creating Clarity with a Unified Observability Stack
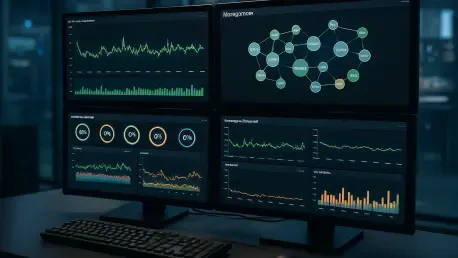
A pivotal step in mastering microservices monitoring lies in the implementation of a unified observability stack, which serves as a centralized hub for managing logs, traces, and metrics. This integrated approach offers a comprehensive view of the entire microservices ecosystem, often referred to as a single pane of glass, where all critical data converges for analysis. By employing interoperable tools, it’s possible to correlate information across different dimensions, revealing hidden patterns or issues that might otherwise go unnoticed. Such a setup drastically reduces the mean time to detect and resolve problems, as teams no longer need to switch between disparate systems to piece together the full story. The result is a streamlined workflow that enhances visibility and empowers quicker, more informed decision-making in high-pressure scenarios.
Taking this concept further, a unified stack addresses the fragmentation inherent in distributed architectures by breaking down silos between tools and teams. When logs, traces, and metrics are accessible from a single platform, the barriers to effective collaboration diminish, allowing for a holistic perspective on system health. This integration also supports advanced correlation techniques, such as linking a spike in error rates to a specific service interaction captured in traces, thereby providing deeper insights into root causes. Additionally, the use of standardized data formats within this stack ensures that visualization and alerting mechanisms operate on consistent inputs, further refining accuracy. By centralizing observability, organizations can shift from a reactive stance to one of proactive management, identifying potential disruptions before they escalate and maintaining a seamless user experience that aligns with strategic goals.
Proactive Vigilance through Continuous Tracking
Effective monitoring of microservices demands continuous tracking of key performance indicators such as service health, latency, and error rates to maintain system stability. Real-time assessment of these metrics enables the early detection of anomalies, often before they manifest as noticeable problems for end users. Automated tools play a crucial role in this process, constantly scanning for deviations and providing immediate feedback on system performance. Dependency mapping complements this by offering a visual representation of how services interact, making it easier to understand the ripple effects of a failure in one component across the entire architecture. This ongoing vigilance ensures that potential issues are caught and addressed swiftly, preserving the integrity of a dynamic, distributed environment.
Expanding on this foundation, continuous tracking also facilitates a deeper understanding of inter-service relationships through detailed dependency analysis. By mapping out how each microservice connects and relies on others, it becomes possible to predict where cascading failures might originate and how they could spread. This foresight is invaluable for isolating issues before they affect broader system functionality, minimizing downtime and user impact. Moreover, real-time data collection supports trend analysis over time, helping to identify recurring patterns or slow degradations that might not trigger immediate alerts but could pose long-term risks. Embracing this proactive approach transforms monitoring from a mere reactive task into a strategic asset, enabling teams to anticipate challenges and maintain a robust, responsive infrastructure that meets evolving demands.
Aligning Metrics with Business through Meaningful SLOs
Monitoring microservices isn’t solely about technical data; it must also connect to broader business outcomes through well-defined service level objectives (SLOs). These objectives act as benchmarks that reflect customer expectations and organizational priorities, ensuring that monitoring efforts contribute directly to enterprise success. Crafting SLOs involves identifying critical metrics, such as system uptime or response times, that tie into user satisfaction and aligning them with actionable targets. Alerts based on these objectives should be precise, triggering only for significant deviations to avoid overwhelming teams with irrelevant notifications. This focused approach ensures that monitoring remains relevant and impactful, directly supporting business imperatives.
Delving deeper, the integration of actionable alerts with incident management systems enhances the effectiveness of SLO-driven monitoring. When alerts are enriched with contextual data, such as the specific service or transaction affected, response times improve as teams can prioritize and address issues with clarity. Avoiding alert fatigue is equally important; by filtering out noise and focusing on meaningful thresholds, the system ensures that only critical incidents demand attention. This alignment between technical metrics and business goals creates a monitoring framework that not only maintains system health but also drives value by safeguarding user trust. Furthermore, regularly revisiting and refining SLOs keeps them relevant as business needs evolve, ensuring that monitoring strategies remain agile and aligned with long-term objectives in a competitive landscape.
Enhancing Troubleshooting with Root Cause Analysis
When incidents inevitably occur within a microservices architecture, the ability to conduct rapid root cause analysis becomes a game-changer for minimizing disruption. Leveraging standardized telemetry data, such as trace IDs and correlation IDs, allows for precise tracking of a request’s journey across multiple services. By linking logs and metrics to specific interactions, this contextual debugging turns a complex investigation into a manageable process. The focus shifts from sifting through unrelated data to following a clear path to the source of the issue, significantly reducing resolution times. Such efficiency is critical in maintaining system reliability and preventing prolonged downtime in a distributed setup.
Building on this, the adoption of automated tools for root cause analysis further streamlines troubleshooting by identifying patterns and correlations that might escape manual review. These tools can aggregate data from various sources, presenting a unified view of an incident’s origins and impacts, which aids in quicker decision-making. Additionally, insights gained from each analysis can inform proactive measures, such as adjusting configurations or reinforcing weak points in the architecture, to prevent recurrence. This iterative process not only resolves current issues but also strengthens the system against future challenges. By prioritizing contextual data and automation, root cause analysis transforms from a reactive burden into a strategic tool, enhancing overall resilience and ensuring that microservices continue to deliver value without interruption.
Cultivating a Proactive Mindset for Future Success
Reflecting on the journey of monitoring microservices, it’s evident that success stems from a deliberate shift toward proactive strategies that anticipate issues rather than merely reacting to them. Standardized observability laid the groundwork by ensuring data consistency, while unified tools provided the clarity needed to manage complexity. Continuous tracking and dependency mapping kept disruptions at bay, and meaningful SLOs bridged the gap between technical performance and business value. Meanwhile, efficient root cause analysis minimized the impact of incidents that did occur. Together, these practices formed a robust framework that turned raw data into actionable intelligence, safeguarding system health over time.
Looking ahead, the focus should pivot to refining these approaches through regular evaluation and adaptation to emerging challenges. Exploring advancements in automation and machine learning could further enhance predictive capabilities, identifying potential failures even earlier. Additionally, fostering collaboration across teams ensures that insights from monitoring are shared and acted upon effectively. By committing to this ongoing evolution, the monitoring of microservices can remain a dynamic strength, consistently aligning with shifting business landscapes and user expectations. Embracing adaptability as a core principle will prepare systems for future demands, ensuring sustained reliability and performance.


