
A standard Kubernetes monitoring architecture separates metric collection, visualization, and alert routing into distinct logical components for better operational management. In the fast-moving cloud-native landscape of 2026, where distributed systems exhibit increasingly complex behavior, the ability to observe internal states has become the defining factor between high-availability services and frequent outages. Engineers now face the challenge of managing thousands of ephemeral containers that spin up and down across various availability zones, making traditional logging insufficient. This environment necessitates a sophisticated approach that combines real-time data ingestion with high-fidelity visualization to provide a comprehensive view of cluster health. By leveraging specialized tools, organizations can move beyond simple uptime checks toward deep-performance analysis, ensuring that metrics become the lifeblood of the DevOps lifecycle for sustained production reliability.
1. Mapping the Monitoring Ecosystem
The foundation of a modern observability stack rests on Prometheus, a powerful engine that utilizes a pull-based model to aggregate time-series data from various sources. Unlike traditional push-based systems, Prometheus actively scrapes metrics from defined endpoints, which significantly reduces the overhead on individual application services. This architecture is complemented by Node Exporter, a utility that runs on every host to capture essential hardware and operating system metrics such as CPU load, memory utilization, and disk I/O. By collecting these low-level statistics, the monitoring system gains visibility into the underlying infrastructure that supports the containerized workloads. Alertmanager acts as the final piece of this logical triad, providing the necessary intelligence to process incoming alerts from Prometheus. It handles grouping and inhibition, ensuring that notifications reach the correct personnel without overwhelming them with redundant information.
Enhancing the core engine involves the use of kube-state-metrics and the Prometheus Operator, both of which provide deep integration with the Kubernetes API. While Node Exporter focuses on the host, kube-state-metrics provides a higher-level view by translating the state of Kubernetes objects into Prometheus-compatible data. This allows teams to track the health of deployments, the status of pods, and the availability of replicas across the entire cluster. The Prometheus Operator further simplifies this management by automating the lifecycle of the monitoring components. It introduces custom resource definitions that allow developers to manage Prometheus instances and scrape configurations using standard YAML manifests. This automation ensures that as the cluster grows, the monitoring infrastructure adapts dynamically without requiring manual intervention. By treating monitoring as code, the Operator pattern provides a scalable and repeatable method for maintaining visibility into high-scale container environments.
2. Preparing the Infrastructure for Deployment
Before implementing the monitoring stack, it is crucial to verify the readiness of the underlying environment to ensure a seamless integration process. This involves confirming that the Kubernetes cluster is fully operational and that the local command-line tools are correctly authenticated with the control plane. Running the command to list active nodes provides an immediate status check of the cluster’s health and ensures that compute resources are available for the new monitoring pods. In 2026, clusters often span multiple cloud providers, making this initial validation step even more critical for avoiding connectivity issues during the installation phase. Establishing a clear communication path between the administrator’s terminal and the API server ensures that subsequent deployment commands are executed against the intended target. A well-prepared environment serves as the bedrock for a stable observability platform, allowing engineers to focus on configuration rather than basic infrastructure troubleshooting.
Managing the complexity of modern software deployments requires a reliable package manager, and Helm remains the industry standard for orchestrating Kubernetes resources. Verifying the current version of Helm installed on the local machine ensures compatibility with the latest community charts and security patches available in the ecosystem. Once the tooling is confirmed, creating a dedicated workspace through a separate namespace is a best practice that prevents resource conflicts and simplifies administrative tasks. By isolating all monitoring components within a namespace called monitoring, teams can apply specific resource quotas and access control policies without affecting other production workloads. This logical separation not only improves security by limiting the scope of service accounts but also makes it easier to clean up or migrate the stack in the future. Organizing resources in this manner reflects a mature approach to cluster management where every functional component has a clearly defined home.
3. Executing the Installation via Helm
The actual deployment of the monitoring suite begins by incorporating the official community repositories into the local Helm configuration to access the latest charts. These repositories are maintained by a global network of contributors, ensuring that the configurations are optimized for performance and security according to current standards. After adding the repository, it is necessary to sync the local data to capture any recent updates or bug fixes that have been released by the maintainers. This synchronization step is vital in 2026, as the rapid evolution of cloud-native technologies frequently introduces optimizations that can significantly improve the efficiency of metric scraping. Keeping the local chart list updated ensures that the installation process utilizes the most refined templates available, reducing the likelihood of encountering deprecated settings or compatibility errors. This proactive approach to package management streamlines the installation and ensures a verified foundation.
With the repositories prepared, the installation of the comprehensive monitoring stack is executed through a single Helm command that deploys Prometheus, Grafana, and Alertmanager simultaneously. This integrated package, often referred to as the kube-prometheus-stack, pre-configures the components to work together seamlessly out of the box, saving hours of manual configuration. Specifying the target namespace during installation ensures that all generated pods, services, and configuration maps are located in the correct logical partition of the cluster. Once the installation process completes, it is essential to confirm the status of the active pods to verify that every component has reached a running state. Checking the pod list allows administrators to identify any initialization failures, such as image pull errors or insufficient resource allocations, which might prevent the stack from functioning. Successful deployment results in a fully operational observability engine ready to collect data from various services.
4. Configuring Metric Scrapers and Service Discovery
The Prometheus Operator utilizes a sophisticated mechanism known as ServiceMonitors to automate the discovery of application endpoints and manage the scraping process efficiently. Instead of manually editing a massive configuration file, developers can define a ServiceMonitor resource that specifies which pods to track based on their metadata labels. This approach allows the monitoring system to dynamically adjust as applications are added, removed, or updated within the cluster, maintaining a continuous flow of data. For this mechanism to work, applications must be designed to expose their internal metrics at a standardized path, typically located at slash metrics. This endpoint provides a raw text representation of the application’s current state, which Prometheus then pulls at regular intervals to build its time-series database. By standardizing the way metrics are exposed and discovered, the organization ensures a consistent observability posture across various development teams.
Handling the ephemeral nature of containerized workloads requires moving away from static IP addresses toward Kubernetes-native service discovery mechanisms. In a scaling environment, pods are frequently destroyed and recreated with new network identities, making traditional monitoring configurations obsolete within minutes. Prometheus overcomes this challenge by querying the Kubernetes API to identify the current endpoints of any service that matches the defined labels in a ServiceMonitor. This native integration ensures that even as the cluster scales from dozens to thousands of pods, the monitoring engine remains synchronized with the actual state of the workload. This dynamic targeting capability is essential for capturing accurate performance data during rolling updates where the number of active containers fluctuates rapidly. Relying on automated discovery reduces the operational burden and ensures that no part of the application remains unmonitored during periods of high volatility in the production environment.
5. Building Intuitive Dashboards in Grafana
Once the data collection engine is operational, the focus shifts to visualizing the ingested metrics through the Grafana web interface to gain actionable insights. Accessing this UI within a private Kubernetes cluster usually involves identifying the specific service associated with Grafana and enabling a secure connection to the local machine. By using a port-forwarding command, administrators can bridge the gap between the internal cluster network and a local web browser, allowing for immediate exploration of the pre-built dashboards. This method provides a secure way to access sensitive performance data without exposing the dashboard service to the public internet prematurely. In 2026, security protocols prioritize these types of temporary, authenticated connections over permanent public endpoints for administrative tools. Upon reaching the interface, users are greeted with a centralized hub where metrics from across the entire cluster are aggregated into a single, cohesive view for exploration.
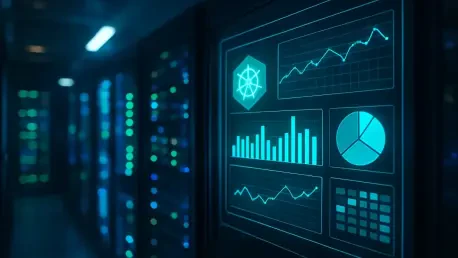
Building effective visualizations requires a strategic focus on the metrics that matter most for operational stability and business performance. High-quality dashboards prioritize node health, pod restart counts, and resource consumption patterns to provide a clear picture of how the infrastructure is coping with the current load. Visualizing CPU and memory usage across different namespaces allows teams to identify resource-hungry applications that may need optimization. Furthermore, tracking the frequency of container restarts serves as a vital early warning system for crash-looping services or underlying configuration issues. Grafana allows for the creation of complex panels that combine data from multiple sources, enabling engineers to correlate infrastructure events with application-level performance metrics. These visualizations are dynamic tools that support drill-down analysis during incident response, helping to pinpoint root causes quickly. Well-designed dashboards empower every stakeholder to understand the state of the cluster.
6. Implementing Advanced Alerting Logic
Establishing effective alerting logic is the final critical step in moving from passive monitoring to an active, self-healing observability strategy. This process involves drafting alert rules that define specific conditions for critical events, such as sustained high CPU usage or a drop in the number of healthy replicas. It is essential to implement threshold durations using the “for” clause in PromQL to prevent the system from triggering notifications during temporary performance spikes that do not require intervention. For example, a momentary surge in memory usage during a startup sequence should not necessarily alert an engineer, whereas a steady climb over several minutes might indicate a leak. By fine-tuning these durations, teams can ensure that the alerts they receive are meaningful and indicate a genuine issue that needs investigation. This precision in rule definition minimizes the noise generated by the monitoring system and helps maintain a high level of trust in the automated notifications sent to the team.
Connecting Prometheus to Alertmanager allows for the sophisticated routing of notifications to various communication channels based on the severity and type of the event. Alertmanager provides the logic necessary to group similar alerts together, preventing a single failure from cascading into a flood of individual messages that obscure the actual problem. For instance, if an entire node fails, the system can group all the resulting pod alerts into a single notification, providing a clearer overview of the incident. In 2026, these integrations often extend beyond simple email or chat notifications to include automated incident response platforms and mobile paging systems. Routing logic can be customized so that critical infrastructure failures are sent to on-call engineers immediately, while minor warnings are directed to non-urgent internal logs. This tiered approach to notification ensures that the right people receive the right information at the right time, enhancing the overall resilience of the organization stack.
7. Applying Production Best Practices for Longevity
Adopting production best practices is essential for maintaining the long-term health and efficiency of a Kubernetes monitoring stack as it grows in scale. One of the most important considerations is refining alert quality to prevent “alert fatigue,” a common issue where engineers begin to ignore notifications due to an excessive amount of false positives. Every alert should be actionable and require manual intervention; if an issue resolves itself automatically, it should likely be a log entry rather than a notification. Additionally, managing disk space through clearly defined storage policies is vital for preventing the monitoring system from exhausting its host’s resources. By setting retention periods that align with business needs—such as keeping granular data for fifteen days—teams can optimize their storage costs. These policies ensure that the monitoring engine remains performant and that historical data is available for analysis without compromising the stability of the Prometheus instance itself during peak loads.
Securing the observability interface and optimizing query performance are final steps that ensured the system remained a reliable asset for the organization. Implementing strong authentication and role-based access for Grafana protected sensitive performance data from unauthorized viewing while allowing different teams to maintain their own specific dashboards. Furthermore, monitoring the health of the Prometheus and Grafana pods themselves was a necessary practice to avoid blind spots that could occur if the monitoring system failed unnoticed. To handle the increased load of complex queries in 2026, recording rules were applied to pre-calculate frequently used data points, which reduced the processing burden during dashboard refreshes. This optimization allowed for faster load times and a smoother user experience when analyzing large datasets. By following these comprehensive steps, engineers established a monitoring environment that was both powerful and secure. This proactive strategy successfully transformed the way the cluster was managed for long-term growth.